
Black-Scholes-Merton Option Pricer (8x Price & 72x Greek Charts)
Forewarned is Forearmed: Welcome to the Advanced Black-Scholes-Merton (with Dividends) Single Options Pricer Calculator, designed to give traders the power to control risk with precision and confidence. This unique option pricing tool helps you make informed decisions by providing real-time insights into Profit & Loss, Delta probabilities, Gamma risk, and key metrics like Theta and Vega for Option short sellers. With intuitive charting available in Excel or Apple Numbers, you'll be equipped to manage your full risk exposure across a wide range of asset prices.
Whether you're navigating complex market conditions or looking to measure your risk, this single Option Pricing Calculator offers both beginner-friendly simplicity and the advanced features experienced traders need. Available with two BSM calculators — the large pale blue charts for plotting Asset Prices (x-axis) and the gold charts for targeting Premiums using different Strike Prices (x-axis) — this powerful tool will help you take control of your risk.
The BSM Calculator features charting for Long and Short Calls and Puts, displaying @Now (live) and @Expiry pricing and Profit & Loss data along with 72 Greek charts for a deep dive into Delta, Gamma, Theta, Vega, and Rho. It also offers precise option pricing, implied volatility projections, and Probability of Profit (POP) calculations to ensure you're always trading with the clearest data possible.
The BSM Calculator allows you, in advance, to know your full risk exposure for a very wide range of underlying asset prices which you can easily adjust, and delivers comprehensive insights through Numbers and Excel Spreadsheet Charting.
Overview of BSM 8x Option Price Charts with 72x Greek Charts. Higher resolution images follow below:

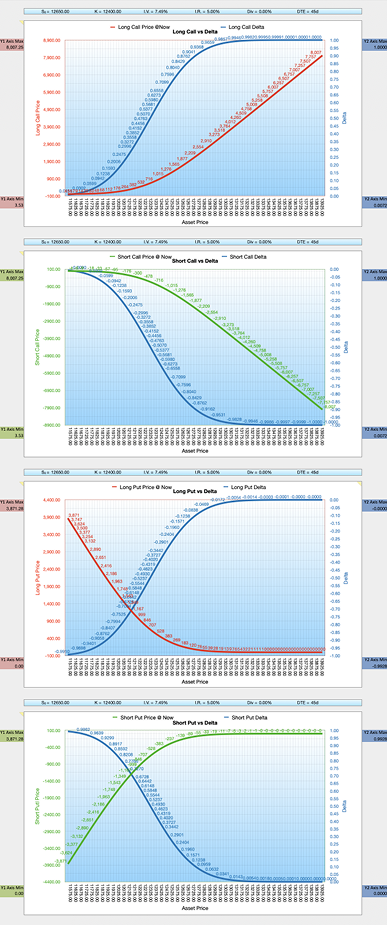
1. Comprehensive Large Charts for Real-Time Decision-Making:
The spreadsheet displays Options Prices live at the current moment @Now and @Expiry, along with Profit and Loss calculations @Now and @Expiry, against Underlying Asset Prices. This data is presented in four separate charts, covering:
Debit = Red Lines = Long Option Price,
Credit = Green Lines = Short Option Price.
• Long Call w. Options Price @Now & @Expiry and P/L @Now & @Expiry
• Short Call w. Options Price @Now & @Expiry and P/L @Now & @Expiry
• Long Put w. Options Price @Now & @Expiry and P/L @Now & @Expiry
• Short Put w. Options Price @Now & @Expiry, and P/L @Now & @Expiry
2. Wide Underlying Asset Price Range:
The Option Pricing calculator accommodates a wide range of asset prices. Eg, setting the £/$ with a 25-tick (adjustable) increment allows the calculator to work out option prices from just above the 1.3700 Strike Price down to the 1.1400 Strike, ensuring you're prepared for various market scenarios (eg former UK Prime Minister Liz Truss crashing the Pound with unfunded Tax Cuts Sept '22).
Set the S&P 500 with a 25-tick (adjustable) increment and a Strike Price of 4300. This configuration allows the calculator to calculate option prices for strikes ranging from just below 3200 to just below 5575, effectively covering a potential 25% market decline. By adjusting the asset width to 50-point increments, the calculator can accommodate asset prices from 2100 to 6800, ensuring comprehensive coverage in option pricing even for a 50% market downturn.
Close up BSM Option Pricer Calculator (top left) and Long Call, Short Call, Long Put and Short Put Charts (clockwise from top left):

Long Call vs Underlying Asset Price Chart:

3. BSM Options Calculator Greek Charts.
There are 20x Smaller Greek Charts for Long Call, Short Call, Long Put and Short Put, displaying the Option Price versus each of these Greeks:Long Call: Delta / Gamma / Theta / Vega / Rho.
Short Call: Delta / Gamma / Theta / Vega / Rho.
Long Put: Delta / Gamma / Theta / Vega / Rho.
Short Put: Delta / Gamma / Theta / Vega / Rho.
In total, you'll have access to 8 large Option Price charts and 72 smaller Greek charts to refine your strategy. The blue charts (4 x large charts + 36 Greek Charts) are for Option Pricing with the Underlying Asset Price on the x-axis. The gold charts (4 x large charts + 36 Greek Charts) are for selecting different Strike Prices to target Premiums with the Strike prices displayed on the x-axis.
The additional 16 charts in blue and 16 in gold are provided to show the relationships between key Greek metrics, eg Gamma vs Theta.
BSM Options Calculator Greeks Charts Overview:

All calculators come with Full Instructions and Comments (see yellow triangles in cells)

4. Additional Greek Studies. BSM Options Calculator Greeks Overview (cont'd):
16x additional Chart studies to show the relationship for a Long Call, Short Call, Long Put and Short Put for:Delta vs Gamma,
Gamma vs Theta,
Gamma vs Vega,
Theta vs Vega.
BSM Options Calculator Greeks Studies Overview:

BSM Greeks: Delta shown for each Option Type:
BSM Greeks Studies: Gamma vs Theta trade off:
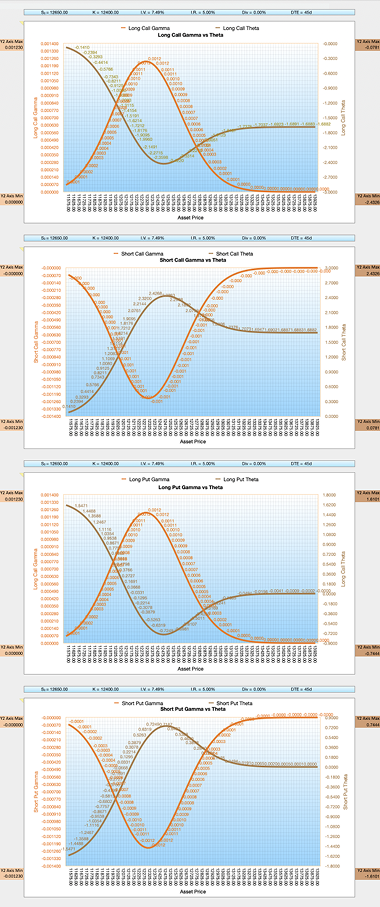
BSM Greeks Studies: Theta vs Vega trade off:

5. BSM Options Calculator:
Comprehensive Option metrics including:
Implied Volatility (I.V.) from Hourly, (for 0 DTE traders), to Monthly.
Max Profit figure for Short Sellers (taking into account trade size).
Red Delta Warning, for Short Sellers targeting Probabilities of Profit (POP) i.e. the Option expiring worthless. To move quickly around the sheet, I've added a section at the bottom in yellow that allows you to open up the cell's formula, eg, $G$8 and once clicked on, it will take you directly to the relevant charts within the spreadsheet.
Enter Option inputs in the blue fields marked with a ">>" in the BSM Calculator (in the top left of the spreadsheet). See BSM Options Calculator image above.
Underlying Asset Price.
Strike Price.
Implied Volatility (I.V.).
Interest Rate (I.R.).
Dividend Yield (Div).
Start & Expiry Dates. (Code Start Date with "@Now" (Numbers) or "@Now()" (Excel) for live Pricing).
BSM Options Calculator:

BSM Calculator Option Engine:

As mentioned above, if you wish to target Option Premiums, enter the typical Option inputs in the top left BSM calculator along with your Strike Price and the gold section (lower half of the spreadsheet) will show you the range of Strike Prices on the x-axis. All corresponding gold charts are exactly the same as the light blue ones except the x-axis is set to Strike Prices.
The BSM Option Calculator Engine in the above image accounts for Fees / Slippage / Spread (choose your preferred cost) and displays:
Option Price @Now Live (Long Calls & Puts (Debit)) || @Now Live Short Calls & Puts (Credit)
Option Price @Expiry (Long Calls & Puts (Debit)) || @Expiry Short Calls & Puts (Credit)
Option Profit & Loss @Now (Long Calls & Puts (Debit)) || Option Profit & Loss @Now Short Calls & Puts (Credit)
Option Profit & Loss @Expiry (Long Calls & Puts (Debit)) || Option Profit & Loss @Expiry Short Calls & Puts (Credit)
Close up of a Long Put with Strike Prices on the x-axis, allowing for easy Premium Targeting. As the Strike Price rises further to the right on the x-axis, the more the higher Strikes Premiums increase.

Key Features Recap:
Accurate Option Pricing to 2 decimal places, enabling you to verify whether your broker is under or overpricing options.
Implied Volatility (I.V.) Projections for hourly, daily, weekly, and monthly market moves, offering a complete view of potential price swings.
0DTE Capabilities: Calculate option premiums right down to the last minutes before expiry for real-time decision-making.
Wide Asset Range Charts: Adjustable points setting to change the amount of points between Underlying Asset Prices or Strike Prices on all the charts x-axis. (See Column B, Row 6 of the BSM Engine above. Same location for the gold Lower Strike Price BSM Engine).
Expected Market Move: Estimate how much an asset is likely to move over any given timeframe, from minutes to months, based on probabilities of 68.2%, 95.4%, and 99.7% (BSM assumes a Normal Distribution).
Live @Now Pricing: Set option Start Dates to the current moment to monitor real-time price changes. (Note: You can alternatively remove the "@Now" code in the Start Date cell and paste the End date in there and adjust accordingly).
Delta Warning: Get a red alert when OTM Delta falls below 60%, helping short sellers stay on top of risk.
Multi-Bank System: Each sheet includes 30 calculators (3 rows of 10), minimising repetitive data entry and enabling quick analysis across multiple assets.
Don't Let Market Uncertainty Catch You Off Guard: Stop Guessing. Start Knowing.
The same Black-Scholes Calculator used by Hedge Funds and Market Makers — Simplified for Serious Retail Traders.
✓ Instant Option Pricing.
✓ See your Exact Profit & Loss Before You Trade.
✓ Real-Time Greeks: Delta, Gamma, Theta, Vega & Rho.
✓ Calculate Risk:Reward Scenarios in One Click.
✓ Professional Edge Without the Learning Curve.
Click "Buy Now" and Download Your BSM Option Pricing Calculator Today.
Best of Luck in Your Options Trading,
Ian,
B.Sc. Finance (Hons), UWIST, Wales.